High-Level Emulator (HLE)
Summary
The High-Level Emulator (HLE) is a C++ project that mimics the Dragon GPU. Inside, it does approximate cycle counting for each major component. Having a C++-based emulator/simulator of the GPU has a large number of advantages:
- Writing HDL to see if an idea works is expensive. We are not used to writing HDL all day, so it takes significant time. We can fairly quickly write an equivalent implementation in C++, vary parameters, and look at profiling information to see if it's something worth optimizing.
- C++ is very expressive which allows us to quickly automate testing some ideas. For instance, at the time of writing, we are wondering if the VPU registers should be composed of Fixed pointer or floating point numbers since there is a large complexity/flexibility/performance tradeoff. In our code, we can quickly change a typedef to swap between different number types.
- We can very quickly visualize results. This is motivating and engaging for us as developers and also lets us focus on high-level questions about image quality, developer experience working with the GPU, etc.
- We emit profiling data from each concurrent component in the system (see below) which allows us to understand current bottlenecks in the architecture. This is one of the primary reasons for the HLE.
HLE Architecture
The HLE program is best described with a few snippets of pseudocode and emulated device hierarchy. Each execution of the HLE runs a "demo" function for each of the frames. For our animations, this is typically ~200 frames. If you're just looking at a single image, it's 1.
void hle() {
    // Load OBJs, textures, etc. needed for running the demo
    load_assets();
    for(frame in 0 ... max_frames) {
        // Simulate execution of the GPU for this frame
        hle_demo(frame);
        // Write framebuffer out
        write_framebuffer_image(frame);
    }
    // Output
    write_profiling_trace();
}
The actual demo function effectively writes a bunch of data to a fake SDRAM, then pushes a bunch of data to the GPU command FIFO, then ticks the GPU (and all of its sub-components) until the command FIFO is empty. At this point, we know rendering (or whatever the demo is testing) is done. Our results should be sitting back in the fake SDRAM.
HLE Timing
"Ticking the GPU" ticks a lot of different entities. The GPU begins pulling entries from the FIFO, activates "functional units" (these are what we call modules that can operate concurrently), and then starts ticking those functional units until they are marked "done".
Some of these things even tick other things. The GPU ticks each of the 4 attached VPUs, the VPUs tick logic that consumes from input queues, they tick the threads (VPTs) within the VPU, etc.
Basic accesses to memory are simply "timed" by setting a timer and counting down. When the timer hits zero, we treat that as if the memory access is complete and go on to the next step of whatever that functional unit is doing. This is a great example where we know roughly the number of cycles needed to access something, and the reality of it is much more complicated (is there contention in the CXB/bus fabric, was this row already open in SDRAM, etc.) but we know enough of the characteristics to provide whatever average, worst case, or other timing we want for this. So it might not be perfectly accurate, but we know it will be accurate enough to make decisions on what and how we need to build the HDL/hardware.
HLE Profiling
Every object that ticks also has a profiler::Process which allows it to report what kind of work it's doing on this tick. Everything from basic things like "Idle", and "Tick", to "Waiting on a memory read result", "Stalled because the queue is full", etc.
All of this is transformed at the end of the execution into Chrome Trace Event Format which is easy to output text format for tracing data that can be loaded into several tools. Each of the Processes tied to functional components is modeled as a "process" or thread in the output trace format, which means it will get a separate track in the trace viewer. This makes it easy to follow what's going on internally.
As an example, here's a trace of a single frame. You can see on the left side a set of processes including the functional units for the GPU, the triangle draw coordination logic, tile buffer fill unit, file buffer store-to-SDRAM unit, VPU program loader, rasterizer, etc. At the bottom, you see 4 tracks, each corresponding to work happening on VPUs. Space is used to show idle functional units.
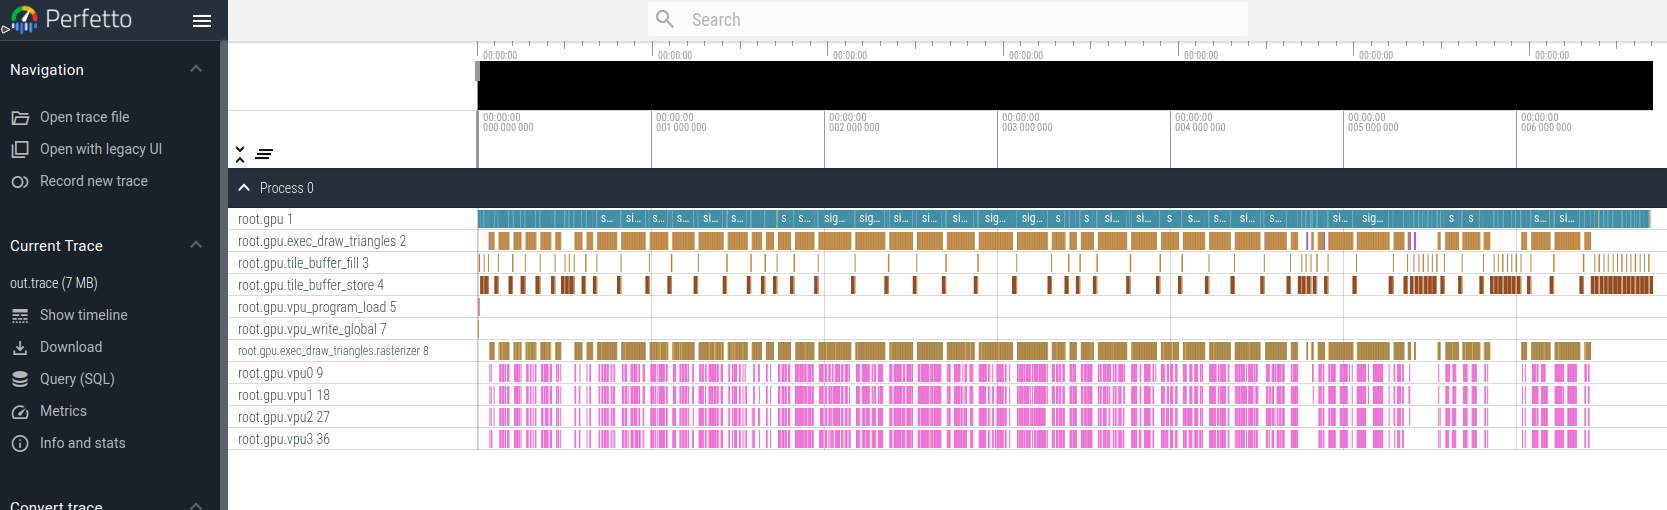
If we zoom way, way, into the picture, you can see a single triangle has indices loaded, then vertex data for those indices, the rasterizer starts to scan a bit over the bin, starts enqueueing work to the VPUs, etc.
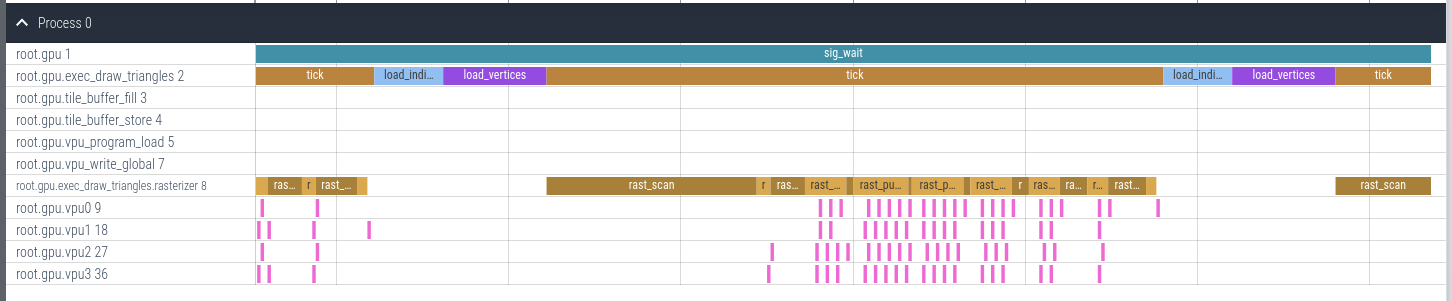
All of the "ticking" happens at a specified clock frequency, and so the x-axis of these traces is actually in units of (nano/micro/milli)seconds, giving us a quick idea of how long something like drawing a bin with a particular shader takes.
Using the Profiling Traces for Optimization
Let's look at a trace that exposes an opportunity for optimization.
Initially, we planned to draw into a bin by doing the following:
- Clear tile buffer 0 (
TB0) contents (or load if it's a second screen pass etc.), the place where we are going to write color data - Wait for the fill/clear to complete.
- Issue a draw for a batch of triangles to render (into
TB0). - Wait for the draw to complete.
- Issue a Store operation so that
TB0is written back to system memory. - Wait for the store operation to complete.
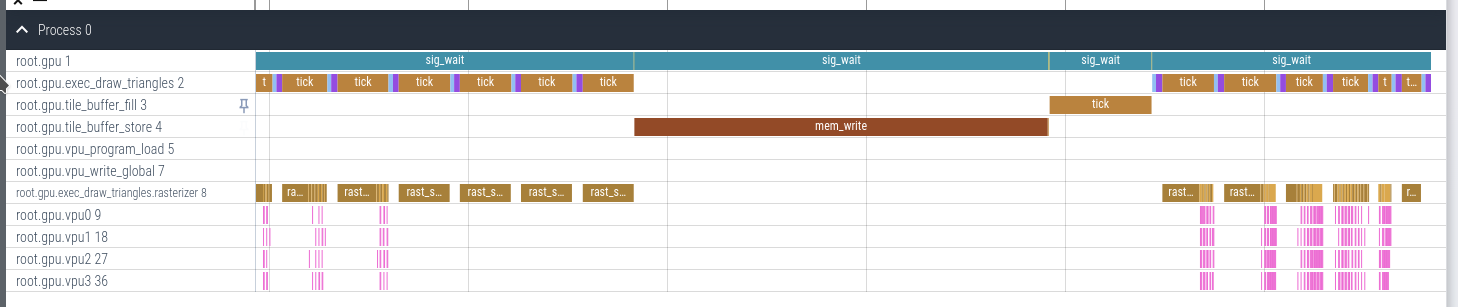
In the trace above, you can see the long mem_write operation for the tile_buffer_store component. With the above logic, we need to wait for this to finish before we can clear it again and draw the next area of the screen.
We have 4 tile buffers available though so we added a small extra bit of flexibility to our tile buffers to enable some pipelining:
- Clear
TB0 - Wait for the clear to complete
- Issue draw to
TB0 - Issue clear for
TB1. - Wait for draw to complete
- Issue store for
TB0 - Issue draw for
TB1 - Wait for draw to complete
- Issue store for
TB0 - ...
While waiting for TB0 to store to SDRAM, we could be rendering into TB1 to hide that latency. This works well so long as the draw time is longer than the tile store, which happens except for the most trivial case. The point is, that seeing these opportunities in the trace viewer is extremely helpful and makes things more "obvious".
Walking through a complete render
For the rest of this article, we'll look a little deeper into the simulation that produces the following image:
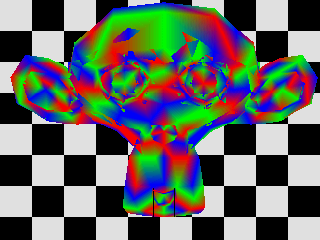
Part 1: Loading vertex, index data, and binning data into SDRAM
Here's a snippet of code responsible for loading our OBJ file vertices into RAM. Our model data comes in as simple vertices with no colors. For now, we give every vertex one of three colors.
// Load model data into SDRAM
const Vec4<Scalar16> colors[3] = {
    { Scalar16(1.f), Scalar16(0.f), Scalar16(0.f), Scalar16(1.f) },
    { Scalar16(0.f), Scalar16(1.f), Scalar16(0.f), Scalar16(1.f) },
    { Scalar16(0.f), Scalar16(0.f), Scalar16(1.f), Scalar16(1.f) },
};
uint32_t color_index = 0;

uint32_t address = vertex_data_address;
for (unsigned j = 0; j < obj_file.vertices.size(); ++j) {
    sys.sdram->write(address, &obj_file.vertices[j], vertex_position_bytes);
    address += vertex_position_bytes;
    sys.sdram->write(address, &colors[color_index], vertex_color_bytes);
    address += vertex_color_bytes;
    color_index = (color_index + 1) % 3;
}
Loading face index data is very similar.
// Load index data
address = index_data_address;
for (unsigned j = 0; j < num_triangles; ++j) {
    sys.sdram->write16(address, obj_file.face_indices[j].a);
    address += sizeof(uint16_t);
    sys.sdram->write16(address, obj_file.face_indices[j].b);
    address += sizeof(uint16_t);
    sys.sdram->write16(address, obj_file.face_indices[j].c);
    address += sizeof(uint16_t);
}
Next, we need to generate binning data. Our 320x240 framebuffer is covered by 80 bins of size 32x32. For each of those bins, we create in memory an array of [count,a,b,c,a,b,c,...] where count is the number of faces that will be drawn in that bin and the a,b,cs are indices into the vertex data array (there are a total of 3*count indices).
// Calculate binning data. This fills a region of memory for each bin containing
// the indices of triangles that should be drawn for that bin
uint32_t bin_data_addr = bin_data_base_addr;
if constexpr (config::TriangleBinning) {
    for (uint32_t bin_y = 0; bin_y < config::FrameBufferHeight; bin_y += config::BinSizeY) {
        for (uint32_t bin_x = 0; bin_x < config::FrameBufferWidth; bin_x += config::BinSizeX) {
            bin_data_addr =
                generate_bin_indices(sys.sdram,
                                    vertex_data_address,
                                    index_data_address,
                                    num_triangles,
                                    vertex_position_bytes + vertex_color_bytes,
                                    bin_data_addr,
                                    { Scalar16(float(bin_x)), Scalar16(float(bin_y)) },
                                    { Scalar16(float(bin_x + config::BinSizeX)),
                                        Scalar16(float(bin_y + config::BinSizeY)) });
        }
    }
}
Part 2: Setup VPU Shader
Next, we create a shader program, which we've abstracted into C++. This same class will do real shader assembly in the future, so this part is also reusable for the final project. Note: This is the simplest possible shader. Without going into the ISA (separate article probably), these vertices are configured to have 2 attributes, which will cause R0 to always have the interpolated screen-space position and R1 will have interpolated attribute 1. In our vertices this is the color we assigned above, so R1 will hold an interpolated color. We just write that register into this thread's location in TB0.
// Setup VPU program
isa::Assembler shader;
{
    using namespace isa;

    // Store color attribute (attr1 -> R1) to TB0
    shader.store(0, R1);
    shader.exit();
}

isa::Program program = shader.program();
sys.sdram->write(vpu_program_address,
                    &program.instruction[0],
                    config::MaxProgramSize * sizeof(isa::Instruction));
Part 3: Fill the GPU Command Buffer
Writing data to the GPU Command Buffer FIFO MMIO register pushes a register write into the queue (anything starting with exec_ actually starts work on a functional unit).
I will not reproduce all of this here, but here is a flavor of some of the stuff written to the command buffer before the actual rendering
using namespace gpu;
CommandBuffer *cb { sys.gpu->command_buffer() };

// Load program to the VPU
cb->set_vpu_program(SysmemAddress { vpu_program_address });
cb->exec_vpu_program_load(SignalBits { SIG_VPU_PROG });

// Configure tile data format, used when storing the tile back to SDRAM
cb->set_vpu_tile_format(TileBuffer { 0 }, color_buffer_format);

// ...

TriangleVertexFormat vertex_format { 0 };
vertex_format.attribute_count = 2;
cb->set_triangle_vertex_format(vertex_format);

// Set base address for vertex data that the indexes refer to
cb->set_triangle_vertex_data_addr(SysmemAddress { vertex_data_address });

// This will cause the GPU to wait for the VPU program load that we started
// earlier to complete before continuing to process more work
cb->sig_wait(SignalBits { SIG_VPU_PROG });
At this point, we're ready to push work to the GPU for each bin.
uint32_t framebuffer_address = framebuffer_base_addr;
for (uint32_t bin_y = 0; bin_y < config::FrameBufferHeight; bin_y += config::BinSizeY) {
    const uint32_t line_start = framebuffer_address;
    for (uint32_t bin_x = 0; bin_x < config::FrameBufferWidth; bin_x += config::BinSizeX) {

        // Read the count of triangles for this bin
        const uint16_t bin_tri_count = sys.sdram->read16(bin_data_addr);
        cb->set_triangle_count(bin_tri_count);

        // Tell the GPU where to load face index data from
        bin_data_addr += sizeof(uint16_t);
        cb->set_triangle_index_data_addr(SysmemAddress { bin_data_addr });
        bin_data_addr += bin_tri_count * 3 * sizeof(uint16_t);

        // Checkerboard background color based on which bin we're in
        if ((bin_x / config::BinSizeX + bin_y / config::BinSizeY) % 2 == 0) {
            cb->set_fill_tile_buffer_value(TileBuffer { 0 }, COLOR_ALMOST_WHITE);
        } else {
            cb->set_fill_tile_buffer_value(TileBuffer { 0 }, COLOR_BLACK);
        }

        // Configure where we are on-screen
        cb->set_bin_top_left(bin_x, bin_y);
        cb->set_vpu_tile_addr(TileBuffer { 0 },
                                SysmemAddress { framebuffer_address });

        // Clear the bin color buffer before drawing
        cb->exec_fill_tile_buffer(SignalBits { SIG_CLEAR_TILE });
        cb->sig_wait(SignalBits { SIG_CLEAR_TILE });

        // Draw triangles
        cb->exec_draw_triangles(SignalBits { SIG_TRIANGLES });
        cb->sig_wait(SignalBits { SIG_TRIANGLES });

        // Write bin tiles back to framebuffer
        cb->exec_vpu_tile_store(TileBuffer { 0 }, SignalBits { SIG_VPU_TILE0 });
        cb->sig_wait(SignalBits { SIG_VPU_TILE0 });

        // ...
    }
    // ...
}
At this point, the GPU is primed and we just need to tick it until it is complete:
// Simulate GPU to completion
static uint64_t t = 0;
uint64_t ticks_this_frame;

const uint64_t MAX_TICKS_PER_FRAME = 100 * 1000 * 1000;
for (ticks_this_frame = 0; ticks_this_frame < MAX_TICKS_PER_FRAME;
        ++t, ++ticks_this_frame) {

    profiler::profiler().set_time(t);

    // If there are no commands pending and we're not waiting for something
    // to complete, we're done!
    if (cb->empty() && !sys.gpu->in_wait_state()) {
        break;
    }

    sys.gpu->tick();
}
assert(ticks_this_frame < MAX_TICKS_PER_FRAME &&
        "GPU simulation ran out of time. Endless wait?");
Done! At this point, we go on to whatever the next frames are and eventually output a trace file.
Part 4: Ticking the GPU
At the top, the GPU ticking commands all other functional units to tick. If the unit is inactive, it just does nothing. The handle_next_command() function will appropriately kick off work on units when we get to an EXEC_-type command.
void GPU::tick()
{
    for (unsigned i = 0; i < config::VPUCount; ++i) {
        m_vpu[i].tick();
    }

    // Tick all the sub-components
    tick_vpu_prog_load();
    tick_draw_triangles();
    tick_tile_buffer_store();
    tick_tile_buffer_fill();
    tick_write_vpu_global();
    tick_vertex_cache();

    switch (m_state) {
        case State::NextCommand: {
            if (!m_command_buffer->empty()) {
                handle_next_command();
                m_proc.tick(profiler::EventType::GPUProcessCommand);
            } else {
                m_proc.tick(profiler::EventType::GenericIdle);
            }
            break;
        }
        case State::Wait: {
            // See all the signals we were waiting on have fired
            m_proc.tick(profiler::EventType::GPUWait);
            if ((m_SIG & m_command.value) == m_command.value) {
                // Clear the bits that we were waiting on
                m_SIG &= ~m_command.value;

                gpu_log("WAIT complete: SIG=0x%x WaitMask=0x%x", m_SIG, m_command.value);
                m_state = State::NextCommand;
            }
            break;
        }
        default: {
            assert(false && "unhandled gpu state");
            break;
        }
    }
}
I will write a separate article on rasterization and on the VPU, so for the time being I'm not going to go into detail on how they're emulated for now. It's not super interesting beyond what the architecture article goes into already.